Individualized Alpha-Wave Matched Entrainment Improves Visual Learning in Adults
Alpha waves are produced in the brain when a person is wakeful and at rest; not working or concentrating particularly hard. Alpha waves in the occipital lobes are associated with visual perception. Researchers at the University of Cambridge recently completed a study on the effect of flickering stimulus on visual learning.
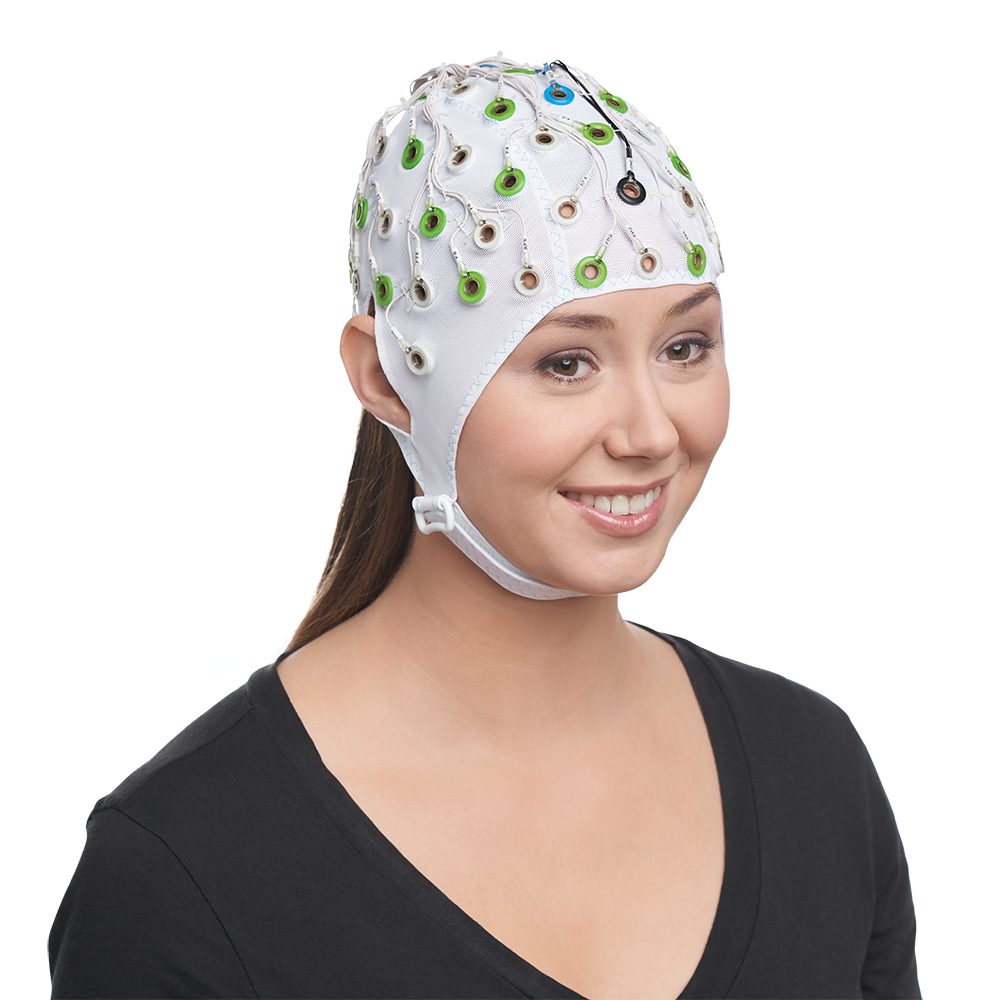
The researchers recruited 100 volunteers aged 18 to 35, 90 of whom were able to participate in the study. Participants wore BrainCaps from BrainVision to measure brain waves. Once their wave patterns were characterized, they were shown images of concentric and radial dot patterns, and then asked to classify partially randomized patterns as radial or concentric. The images were shown for 200 milliseconds. Between images the participants were shown a square flicker in the center of the screen. It was set to match either peaks or troughs in Alpha wave patterns, or was slightly offset from the peak or trough. The flicker was shown for 15 cycles. The experiment was broken into two sessions. In the second session no flicker or EEG was used.
The groups given Alpha wave matched flickers learned to identify the patterns more accurately over the course of the experiment, though their accuracy started out lower than the non-matched group. The non-matched group showed no improvement.
More interesting is that the participants who were given trough-matched flickers learned more than three times faster than the peak-matched group. That learning was sustained the next day when participants were tested a second time. Previous studies using flickering stimulus showed inconsistent results in learning patterns. This study shows that individualized stimulus is effective in improving visual learning in willing adult participants.

(A) The image on the right is from the study, and credit is given to the researchers. At the top left are the ideal forms of the images, and on the right are the partially randomized versions.
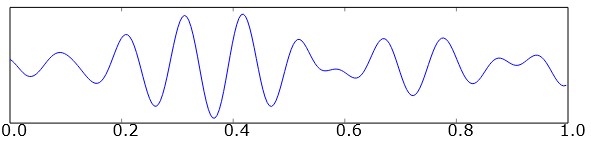
(B) Visual representation of the visual flicker
(C) Representation of the peak, trough, and non-Matched groups
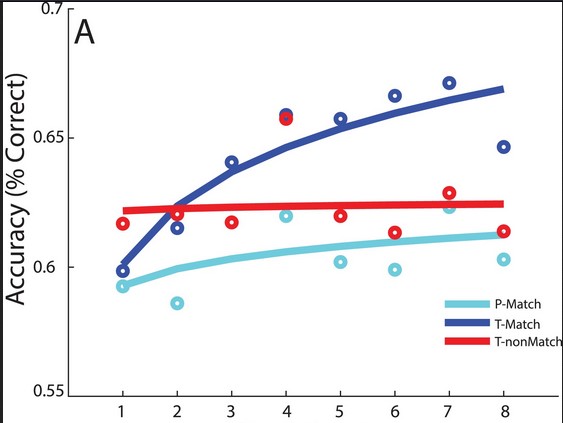
The bottom image shows the learning curves of the peak-matched, trough-matched, and non-matched participants
Posted on February 3, 2023, in Biology, EEG, Neuroscience and tagged Biology, EEG, Learning, Neuroscience. Bookmark the permalink. Leave a comment.

Leave a comment
Comments 0