The Distance and Power of Mr Rodgers Pass
The Green Bay Packers and Detroit Lions played their second game of the 2015 season on December 3rd. It ended with a highly unlikely Hail Mary catch by Richard Rodgers to score the winning touchdown. In the days following the game I heard many, many different people expressing excitement and admiration for the play, with one colleague even declaring Aaron Rodgers “The best quarterback in the NFL”.
The league posted a video clip asking “How far exactly did Rodgers’ Hail Mary Travel?”. The official marking of 61 yards is shown at the bottom of the screen. This is the distance from the line of scrimmage at the start of the play to the front of the end zone line. Ben Rohrbach expressed his belief that the total travel distance of the ball was close to 100 yards, including the vertical and horizontal elements.
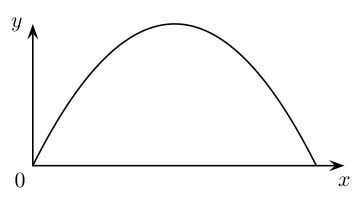
Objects vaulted into the air follow a parabolic vertical path. Credit: Plus Magazine
When a ball is thrown, kicked, or otherwise sent with force into the air, the vertical profile will be shaped like an upside down parabola. This is because gravity acts with constant downward acceleration against the object. The total distance along this segment of a parabola is known as the arc length. It can be calculated by integrating the changing height across the horizontal distance. Wolfram’s discussion is here, and Had to Know’s is here.
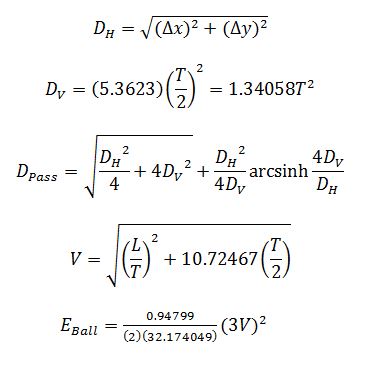
Equations from Top: Horizontal Distance from Pythagorean Theorem; Vertical Distance calculated from hang time; Total Arclength from integration; Starting velocity of the ball neglecting drag force; Energy imparted to the ball by the passer
With that out of the way, the objective is to calculate the actual arc length of Aaron Rogers December 3rd pass. The same method can be used to calculate golf drives, log throws, rock catapultations, etc…. Note: Air friction is neglected in the following discussion.
The horizontal distance of the pass is calculated via the Pythagorean Theorem using length and width coordinate estimates from the back end zone and visual top of the field. The image below shows how this was done for Aaron Rodgers throw. The throw starts an estimated 39 yards from the back end zone, and ends 103 yards from the same end zone. At the start it’s an estimated 13 yards from the top sideline, and it ends about 18 yards from the same sideline.
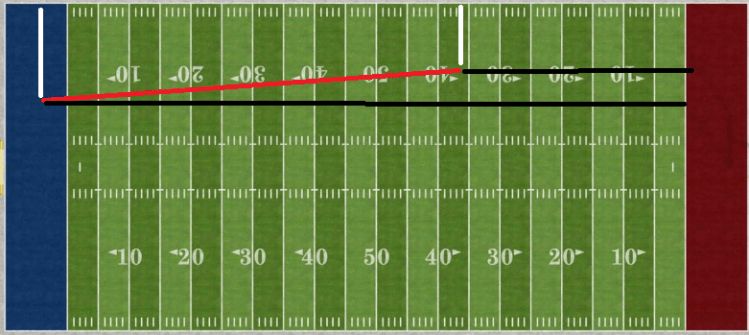
Method of estimating the actual horizontal distance of a pass. Black lines demonstrate start and end distances from the passer’s back end zone, and white lines demonstrate distances from the “top” sideline. Image Credit: Light Headed Beds
The second step is to estimate the total height attained by the ball, minus the height of the passer. Here, I assume that the ball was caught at the same height from which it was thrown. The vertical displacement in yards can be calculated by estimating the hang time, squaring it, and multiplying by 1.34058.
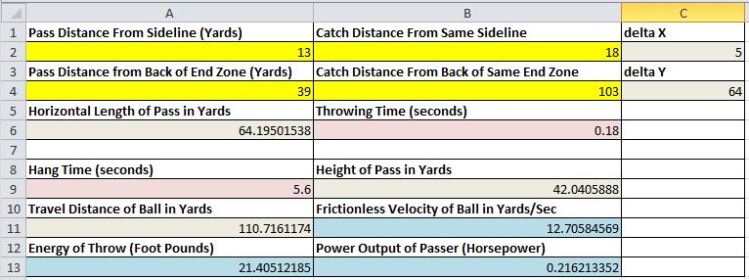
Once the vertical and horizontal displacements are measured, the rest can be calculated in a straightforward manner. Using my estimates of pass start at (13,39), catch at (18,103), and hang time of 5.6 seconds I got the following results:
- Horizontal Displacement: 64.195 yards
- Vertical Displacement: 42.041 yards
- Total Travel Distance: 110.716 yards
- Velocity of Pass: 12.706 yards per second
- Energy Imparted to Football: 21.405 foot pounds
- Power Output of Aaron Rodgers during pass: 0.216 horsepower
This admittedly armchair analysis vindicates Rohrbach, and calculates Aaron Rodgers throwing technique to be as strong as just over a fifth of a horse. The image of my Excel output is below, with the following cell formulas:
- A6 =SQRT(C2^2 + C4^2)
- A11 =SQRT((A6^2/4) + (4*B9^2)) + (A6^2/(8*B9))*ASINH(4*B9/A6)
- A13 =(3*B11)^2*(0.94799/(2*32.174049))
- B9 =1.34058*A9^2
- B11 =SQRT((A6/A9)^2 + 10.72467*(A9/2))
- B13 =(A13/B6)/550
- C2 =ABS(B2-A2)
- C4 =ABS(B4-A4)
Posted on February 28, 2016, in Uncategorized. Bookmark the permalink. Leave a comment.

Leave a comment
Comments 0