Changes in US Oil and Natural Gas Production, Employment, and Productivity 1980 to 2016
“Come and listen to a story ’bout a man named Jed
Poor mountaineer barely kept his family fed
Then one day he was shooting for some food,
And up through the ground come a bubbling crude
(Oil that is, black gold, Texas tea)
Well the first thing you know old Jed’s a millionaire
Kin folk said Jed move away from there
Said California is the place you oughta be…”
—The Ballad of Jed Clampett
Oil and natural gas have been important in the US and globally for nearly 180 years, with that importance spiking following invention and widespread adoption of the internal combustion engine in the 19th and 20th centuries. Beginning in 1973, the US began consuming more crude oil than could be domestically produced. Dependence on global markets made the US economy vulnerable to oil-price shocks in the 1970s, and acted as one of several proximate triggers for the 1990-1991 recession.
In order to better understand production and labor dynamics in US oil and gas production over time, I examined and downloaded production data from the Energy Information Administration (US DoE) and oil and gas employment data from the Bureau of Labor Statistics (US DoL). Graphs of the raw data are below:

Natural Gas Withdrawals and Production in the United States, Jan 1980 through Sept 2016.

US Field Production of Crude Oil, Jan 1920 through Sept 2016.

Oil and Gas Employment in the US, Jan 1972 through Nov 2016.
A few points stand out when examining the data:
- Natural gas production reached a bottom in the mid-1980s, rising modestly until the mid-1990s, and remained stable until the mid-2000s. Production is currently just off the 2014-2015 peak.
- Crude Oil production in the US peaked in the early 1970s, though oil and gas employment peaked around 1980. Since then, a second production peak occurred in 2015, though production has fallen off slightly since then.
- In spite of recent peaks in production, employment in oil and gas extraction is about 35% off the 1982 peak of 266 thousand workers.
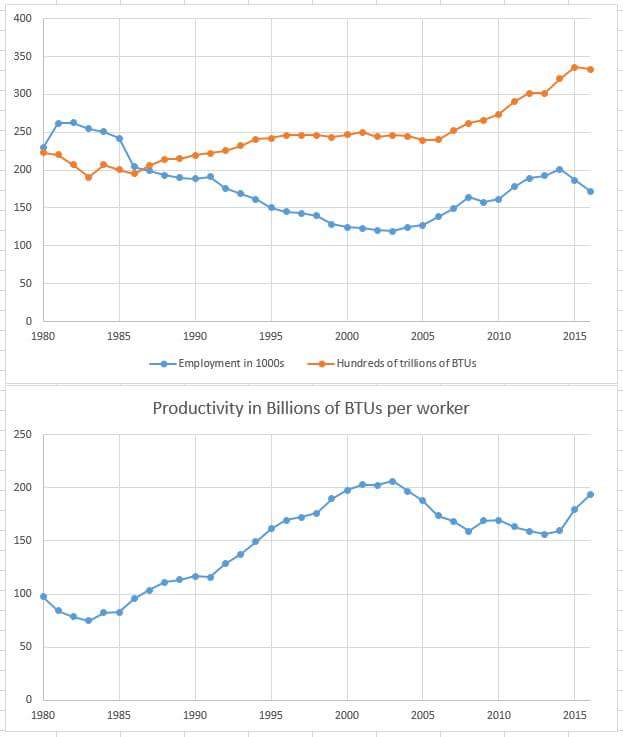
To examine oil and gas combined production and productivity, data was downloaded and opened in MS Excel. Annual barrels of oil and millions of cubic feet of natural gas were converted to British Thermal Units (BTUs). September employment levels were used for each year. The total production series was divided by the employment series to calculate productivity in BTUs per worker.

Oil and Gas Extraction Employment in 1000s (top), Total Crude Oil and Natural Gas Production in 10^14 BTUs, and Productivity in 10^9 BTUs per worker, 1980 though 2016. Author’s Calculations.
The productivity data shows a nearly unbroken 20-year increase from 1983 to 2003, a modest decline, and some leveling until 2014, and then a return to productivity growth. As one would expect, productivity increases tend to correspond to falling or stable crude oil prices. Productivity by this measure tends to decline when prices are rising. This makes sense because rising prices can be expected to follow periods of falling production (affecting the numerator), and lead to increases in employment (affecting the denominator).
The following is my opinion only, freely given, worth what you’ve paid for it, isn’t meant to be career or investment advice, and isn’t necessarily the view of my employer or anybody else: The shale revolution has gone global, and demand growth is expected to be slow due to demographics and consumer preferences in the developed world. Because global supply is much less constrained than demand, I expect crude oil prices to stabilize in the 60 to 80 dollar per barrel range for the next several years, assuming no severe shocks to global supply or demand. In order for profitability of US resources to be maintained productivity must continue to improve, implying modest but steady increases in production, and net employment changes occurring very slowly.
Posted on December 26, 2016, in Uncategorized. Bookmark the permalink. Leave a comment.
Leave a comment
Comments 0